Sustainability
Product Carbon Footprint
How much greenhouse gas emissions are associated with a product along its life cycle? This question has become increasingly important over the past years and a Product Carbon Footprint (PCF) can help to find answers.
The PCF sums up the total greenhouse gas emissions generated by a product over the different stages of its life cycle. For example, a cradle-to-gate (partial) PCF considers all the processes from extraction of resources through manufacturing of precursors and the making of the final product itself up to the point where it leaves the company gate. A cradle-to-grave PCF covers the complete life cycle of the product, including the emissions from the use phase and end-of-life of the product.
The following graphic shows the different life cycle stages of a typical BASF product. It explains the PCF contribution of each step and the type of emission it is assigned to (Scope 1, 2, 3).

Processing
The emissions related to processing can vary greatly depending on the purchased raw material. Generally upstream commodities (oil, gas, base chemicals) cause rather low processing emissions, whereas fine chemicals/specialties (resins, precious metals) carry higher emissions due to the complexity of their production routes.
Transport
For most raw materials sourced by BASF, emissions from transportation are relatively small in comparison to the total PCF (<5%). This is due to the fact that BASF’s raw materials are mostly transported in bulk and in rather large quantities, leading to low specific emissions.
Energy
For BASF, the purchase of electricity at sites that are not yet supplied by renewable electricity is responsible for the largest share of Scope 2 emissions. In some cases, BASF is also supplied with steam for its processes by other companies close by. The specific emissions (kg CO2/kWh) depend on the energy provider's energy mix.
Own emissions
For BASF, the most important drivers are process emissions from our production plants (CO2, CH4, N2O, HFCs), emissions from our power plants to produce electricity and steam for the Verbund sites, as well as emissions from the disposal of waste streams in our waste treatment facilities.
Transport
Transport emissions caused by the product after it leaves BASF’s gate. BASF can calculate data for the transport from BASF to its direct customers on demand.
Use phase
Emissions associated with use of the BASF product, either as is or incorporated in a customer's product. Since the range of application for BASF’s products is very diverse, use phase emissions of a product vary according to its usage.
End of life
Emissions from waste disposal and treatment of BASF’s products at end-of-life. End-of-life treatment methods include e.g. recycling, incineration or landfill, resulting in different specific emissions.
Extraction
The emissions caused by the extraction of materials from the environment for further use, e.g. mining of coal, production of oil or natural gas, cultivation and harvesting of crops.
BASF is highly committed to continuously reduce the PCF of its products. The green graphic demonstrates the reduction levers throughout our value chain.

Raw materials
BASF creates transparency and increases accuracy of its raw material related emissions by inquiring suppliers’ PCF information for procured materials. Based on this, PCF will become an additional criterion for targeted procurement of raw materials with lower carbon footprints. In parallel, BASF introduces circular feedstocks with biogenic or recycled characteristics into the value chain. The high raw material impact on BASF’s PCF (on average ~70%), makes these activities an important reduction lever.
Energy purchase
The largest reduction lever for Scope 2 emissions is the sourcing of green electricity (GE) which reduces emissions to nearly zero. This can be achieved via direct procurement from the energy provider or through purchase of renewable energy certificates. An additional lever is the utilization of green steam, however here, markets are still in development.
Own emissions
The interconnected production of BASF (Verbund) helps to produce efficiently and reduces waste. Emission reductions are driven by continuous process improvements, use of biofuels, and the large transformation projects (e.g. e-furnace, methane pyrolysis, heat pumps, carbon capture and storage). To cover the energy demand of those projects BASF invests in renewable energy production.
Downstream emissions
Scope 3 downstream emissions of BASF’s are mainly governed by the product’s carbon content and the method of disposal. While incineration in waste treatment plants leads to emissions equivalent to the carbon contained in the product, end-of-life emissions are greatly reduced if the waste is recycled into new products (e.g., by depolymerization or pyrolysis for ChemCycling®).

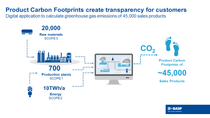
While BASF is continuously working to achieve net zero CO2 emissions by 2050, more and more customers are making environmentally conscious purchasing decisions. Therefore, BASF has developed a digital application to calculate the cradle-to-gate PCFs for its 45,000 sales products. It enables BASF to provide PCFs for its global portfolio. Customers thus will receive valuable information about the extent to which BASF materials contribute to the carbon footprint of their business activities and their own final products.
BASF's PCF calculation is based on GHG emissions from its own plants and high-quality average data for purchased raw materials as well as purchased energy. BASF will gradually replace average data with supplier specific data for purchased raw materials, as soon as they become available from our suppliers.

Options for reducing PCFs
PCFs provide our customers with valuable information on levers for avoiding greenhouse gas emissions. Already today we offer them added value through the use of alternative raw materials. In this way, we help our customers reduce the carbon footprint of their products.
One example is BASF's biomass balance approach, in which fossil resources are replaced by renewable raw materials, e.g. biomethane or bio-naphtha derived from biomass, in the production Verbund and attributed to the sales product. The BASF sales products from this approach have the same properties as products based on purely fossil raw materials – but with a lower carbon footprint.
- More about Biomass Balance
More information about ZeroPCF products and LowPCF products
BASF increasingly offers products with a reduced CO2 footprint (Product Carbon Footprint, PCF) in response to rising demand from customers.
How is the PCF calculated?
How can PCFs be reduced?
What is a LowPCF product?
What is a ZeroPCF product?
Promotion of international standards and rules
BASF’s PCFs are calculated following general standards for life cycle assessment (ISO 14044) and carbon footprints of products (ISO 14067), as well as the Greenhouse Gas Protocol Product Standard.
These standards do not, however, include concrete specifications as to how exactly the PCF is to be determined for individual products. In the absence of such rules, PCFs of the same products from different companies cannot yet be fully compared. In order to create a level playing field, BASF is committed to the introduction of product-specific guidelines for the calculation of PCFs in the chemical industry to create an industry-wide level playing field and comparability of products.
How to get a more holistic sustainability assessment
PCFs create transparency about greenhouse gas emissions associated with our products. At the same time, they are only one piece of a bigger sustainability picture. Comprehensive sustainability assessments of products include environmental, economic and social criteria. If customers want to get a more holistic picture, we recommend multi-criteria assessment tools like our Eco-Efficiency Analysis.
