Sustainability
BASF’s Value-to-Society: Results 2013-2023 at Group level
Change in methodology
To understand the economic, environmental and social value BASF contributes to society along the value chain, we initially developed the Value to Society (VtS) approach in 2013 and have reported until 2020 the VtS results. To drive a standardization of impact valuation and thus allow comparability of impact assessments across companies, BASF was then a founding member of the Value Balancing Alliance (VBA) in 2019.
The change to the VBA methodology in 2020 implies that impacts reported in previous years are not directly comparable. Additionally, new indicators were included (child and forced labor). Ongoing piloting at VBA member companies will lead to further enhancements.

2023 (VBA)
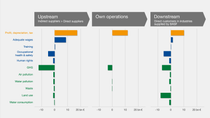
Interactive year-on-year comparison 2020 - 2023 (VBA)
Find more information on the impact categories by clicking the arrows.
2022 (VBA)
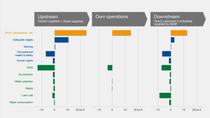
2021 (VBA)
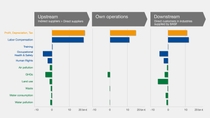
2020 (VBA)
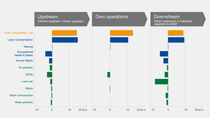
Comparison of the results – 2020 vs. 2019 (VBA)
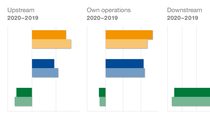
To different extents, both positive and negative economic and social impacts decreased. Changes for environmental impacts were smaller. The main driver was the Covid19 pandemic, that lead to an overall lower economic activity.
Overall, economic impacts decreased by 1%. However, they increased in own operations by 12% because intermediate consumption decreased stronger than output. Supply chain impacts decreased as consequence of the reduced spend.
Environmental impacts decreased slightly across all value chain levels. The main exception is water consumption in customer industries, which increased by 37% due to shifts in the sales portfolio. Noticeably, the GHG impact increased for own operations by 9% but decreased overall by 4%.
Both negative and positive social impacts decreased overall. OHS impacts dropped by more than 50% in own operations, the main impacts occur however in the other value chain levels. Labor compensation decreased 3% in own operations, and overall by 6%. For human rights, the impact decreased by 11% in the supply chain, by 2% in customer industries, no impacts are recorded in own operations.
The aggregate changes are mainly driven by the supply chain results. Driven by a decrease of the purchase volume by 10%, impacts along the supply chain decrease for all impact indicators between 5% and 12%.
While the economic impacts for BASF operations increased, training hours and absolute wages paid decreased. Except for GHG impacts, there was a marginal improvement for environmental impacts.
Driven by only a slight increase in the sales volume by 3%, most impact changes in customer industries are marginal. The economic and social impacts improved slightly. The largest improvement for environmental impacts was in land use (-12%), the largest increase in water consumption (+37%). Such effect differences occur due to sales pattern changes.
2019 (VBA)

Interactive year-on-year comparison 2013 - 2020 (VtS)
Find more information on the impact categories by clicking the arrows.
2020 (VtS)
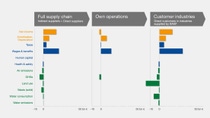
BASF’s Value-to-Society: Changes from 2019-2020
Compared to 2019, the Value-to-Society contribution shows a total reduction of 26% in 2020. The main driver was the coronavirus pandemic which resulted in a reduced economic impact and higher environmental impact.
Total economic contributions were significantly lower compared to 2019 (-19%). Major driver was the negative net income in BASF operations because of negative effects from the pandemic to the economy.
Total social benefits showed a decreased contribution of 8% compared to 2019. The main drivers can be traced back to the pandemic. A reduction in taxes contribution especially in our supply chain and own operations lead to a reduced impact.
Total environmental contributions showed a higher impact compared to the prior year (25%). Among other things this is related to the increased water consumption and land use in downstream customer industries.
Supply chain: During the crisis year 2020 the economic, social, and environmental categories changed significantly – positive impacts have decreased and negative impacts have increased. Compared to the year 2019 our suppliers contributed overall 21% less. This reduction can be related to multiple drivers. One driver was the reduced revenues earned due to the pandemic in the economic category. The increase in solid waste in the environmental category was an additional factor and increased the negative contribution in the environmental category.
BASF operations: Significantly lower contributions compared to 2019 (-42%) given the significant decrease in the economic category due to negative effects of the pandemic. The negative net income in 2020, and therefore lesser taxes paid, had a significant negative impact.
Customer industries: The customer value chain contributed overall 17% less than the year before. Major drivers in the environmental category were land use, water consumption and GHG emissions and economic and social categories as well.
2019 (VtS)
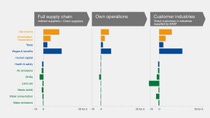
BASF’s Value-to-Society: Changes from 2018-2019
Compared to 2018, BASF’s Value-to-Society contribution shows a 2.7% decrease mainly due to reduced contributions from supply chain and customer industries.
The total economic contribution of the value chain has remained stable from 2018 to 2019 (+0.3%). Total social benefits declined slightly by 1.3%. The environmental impact has increased by 5%. This is primarily due to a significant increase in the downstream land use, which is related to increased sales into the agricultural industry. The total 14% reduction in the GHG impact associated with the lower procurement volumes and in BASF’s operations had a positive effect but could not compensate.
- Supply chain: From 2018 to 2019, there was a total 6.9% reduction basically due to reduced volumes. This led to a decrease in economic and social contribution, but as well to a reduction of environmental impacts in the supply chain by 24.5%.
- BASF operations: BASF’s direct impact increased by 15.7% compared to 2018. This is mainly driven by economic and by social contributions. Environmental impacts of BASF’s operations decreased significantly by 8.6%.
- Customer industries: The downstream contribution decreased by 9.7% versus 2018 due to environmental impacts of our customer industries, mainly land use, GHG and water due to the increased sales to the agricultural industry. The social and economic contributions increased slightly but could not compensate.
2018 (VtS)
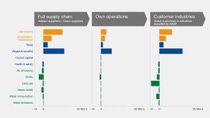
BASF’s Value-to-Society: Changes from 2017-2018
Compared to 2017, our net Value-to-Society has been stable. The analysis demonstrates a decreased economic contribution but improved social benefits and slightly higher environmental costs to society.
The overall impact to society is driven by changes in our portfolio and the decrease in operational profits (-20,5%). However, in general the overall economic, social and environmental impact was rather stable. The total economic contribution was 3% lower, the total social benefits increased by 2%, the environmental costs grew by 2%.
- Supply chain: Between 2017 and 2018 there was a 2% decrease in our purchases. This is reflected in a 1.4% decrease in total impacts by our supply chain partners. Most significant is a 5% decrease in upstream profits linked to a reduction in purchases from the gas sector.
- BASF operations: The direct impact has decreased by 4%. This is mainly driven by a 20,5% decrease in income.
- Customer industries: Our total sales decreased by 5%versus 2017. However, the total impact has remained constant. This is linked to a shift in sales to non-European markets leading to higher positive impacts. Significant reductions in impact for European energy, construction and consumer goods with significant increases in impact in Middle Eastern energy, North American energy and chemicals and South American agriculture.
2017 (VtS)
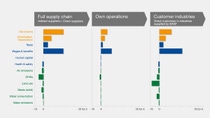
BASFs Value-to-Society: Veränderungen 2016-2017
Im Vergleich zu 2016 ist unser Value-to-Society im Jahr 2017 netto um 9% gewachsen. Diese Entwicklung geht auf gestiegene ökonomische und soziale Wertbeiträge für die Gesellschaft zurück, die den Anstieg der ökologischen Kosten deutlich übersteigen.
Insgesamt werden die Auswirkungen unseres Handelns auf die Gesellschaft durch den Anstieg unseres Umsatzes um 7 Milliarden € (+12%) verursacht. Im Vergleich zu 2016 führt dies zu einem positiven ökonomischen (+15) und sozialen (+9%) Wertzuwachs in der Gesellschaft. Im Vergleich zu 2016 sind die negativen Auswirkungen um 24% angestiegen. Wesentlich hierfür sind überarbeitete Koeffizienten zur monetären Bewertung der Auswirkungen unseres Handelns auf Umwelt, Gesundheit und Sicherheit. Zusätzlich führt unser Umsatzwachstum zu höheren Kosten für die Gesellschaft wie durch Ressourcennutzung, Emissionen oder Vorfälle im Bereich Gesundheit und Sicherheit.
- Externe Zulieferer: Aufgrund gestiegener Aktivitäten und Volumina im Einkauf haben wir eine Erhöhung des Netto-Wertbeitrages unser Zulieferer für die Gesellschaft von 12% ermöglicht. Die wesentlichen Veränderungen zu 2016 sehen wir in Gewinn, Löhnen, Treibhausgasen und Abfall.
- BASF-Produktion: Die Ergebnisse zeigen einen Netto-Wertzuwachs für die Gesellschaft von 14%. Die positiven Beiträge erfolgen über Nettogewinn und Steuern, die wichtigsten Kostenzuwächse im Umweltbereich verursacht durch die überarbeiteten Koeffizienten.
- Kundenindustrien: Aufgrund des gewachsenen Umsatzes haben wir bei unseren Kunden einen Netto-Wertzuwachs von 3% ermöglicht. Die positiven Entwicklungen bei Nettogewinn und Löhnen wurden durch gestiegene Kosten bei Wasserverbrauch, Abfall und Landnutzung verringert. Die gestiegenen Kosten gehen wesentlich auf die überarbeiteten Koeffizienten zurück.
2016 (VtS)
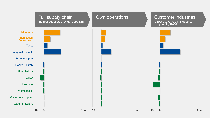
BASF’s Value-to-Society: Changes from 2015-2016
Compared to 2015, our net Value-to-Society 2016 decreased as expected by 28%. The main driver is our reduced sales volume by 13 billion €. The major share of the sales decrease is caused by the divestment of our gas trading and storage business to Gazprom, which contributed 10.1 billion € to our total sales in the previous year.
- Suppliers: Overall, the net contribution from our external suppliers decreased by 35%. The main driver is the divestment of the gas trading and storage business resulting in a substantially lower total purchase volume from the oil and gas sector with specific downside effects on profits, wages and taxes. This decrease was lessened by reduced environmental impacts (e.g. waste, GHG) to society.
- BASF operations: The results show an increase by 3% of our net Value-to-Society contribution – mainly driven by increases in profits, amortization and depreciation as well as wages. In addition, some cost factors declined, such as water pollution.
- Customers: Overall, the enabled net contribution by our customer industries decreased by 12%. As main driver the divestment of the gas trading and storage business accounted for substantially lower sales volumes into the energy and utility sector with specific downside effects on profits and wages. This decrease was lessened by lower costs to society due to reduced GHG emissions.
2015 (VtS)
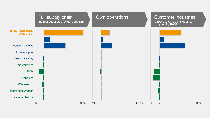
BASF’s Value-to-Society: changes from 2014-2015
Due to a decrease in volume, BASF’s Value-to-Society (full supply chain, BASF operations and customer industries) decreased by 9%.
- Suppliers: The sales volume caused a lower purchase volume leading to lower profits, taxes and wages for BASF’s external suppliers. In addition, this development was amplified due to a change in the portfolio of the external supplier value chains with a relatively lower intensity in profits, taxes, and wages. Overall this results in a 14% lower net contribution from our external suppliers.
- BASF operations: The increase in wage payments in combination with stable employment in BASF Group overcompensated the decrease of profits, taxes, and GHGs. The slight increase of the social cost of carbon (GHGs) is driven by a higher monetary valuation multiplier compared to 2014 (the quantitative emissions volume in tons of CO2 emissions decreased by 2%). Overall, BASF operations have a slightly increased net positive contribution in 2015 – overall 1% net contribution.
- Customers: The lower sales volumes reduced profits, taxes and wages in customer industries. In addition, due to higher sales in agribusiness the negative impact to society by land use increased. Overall, this resulted in a 5% lower net contribution.
2014 (VtS)
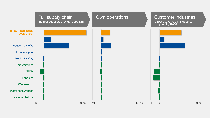
BASF’s Value-to-Society: Changes from 2013-2014
Due to a sales volume growth BASF’s Value-to-Society (full supply chain, BASF operations and customer industries) increased by 2%.
- Suppliers: The net contribution decreased by 0.5%. This reflects a constant contribution within the limits of measurement accuracy.
- BASF operations: The 3% increase of the net contribution is driven by higher sales and related higher production volumes.
- Customer industries: The 6% higher net contribution is reasoned by higher sales volumes. The related increase in profits and wages substantially overcompensated the increasing costs to society by GHGs and land use. The net positive contribution of customer industries was amplified by a relative shift to a more profit and wage intense country and sector split of BASF’s sales portfolio.
2013 (VtS)
