Investors

Analyst Estimates

BASF is widely covered by various German and international financial analysts, who provide their own research analyses and earnings estimates in respect of the company. On this page we provide you with the analyst estimates compiled monthly by Vara Research.

As before, BASF will neither be involved in the collection of the information nor in the compilation of the estimates; this will still be done independently by Vara Research.

The analyst estimates are exclusively based on the analyses of financial analysts who are independent from BASF. Any opinions, forecasts, estimates, projections or predictions regarding BASF’s performance (ultimately represented by the figures of the analyst estimates) given by the analysts only reflect their view and do not represent the opinions, forecasts, estimates, projections or predictions of BASF or its management.

BASF SE only renders the analyst estimates (average, high and low) compiled by Vara Research on this website. This does not imply that the company endorses, concurs with or adopts such information, conclusions or recommendations. BASF assumes no liability for the accuracy of such estimates and undertakes no obligation to update or revise such estimates, even if they differ from our own forecasts or expectations.
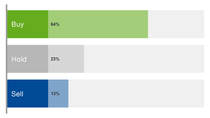
Chart with the current recommendations for Buy - Hold - Sell

BASF Share

Average High Low
Target share price 55.50 72.00 43.00

BASF Group Estimates

Million € Average High Low
Sales 16,801 17,740 16,068
EBITDA before special items 2,087 2,300 1,842
EBITDA 2,053 2,246 1,842
EBIT before special items 1,110 1,324 847
EBIT 1,072 1,254 844
Income before income taxes 971 1,314 570
Net income 707 1,011 409
Earnings per Share (reported) (€) 0.79 1.13 0.46
Earnings per Share (adjusted) (€) 0.90 1.13 0.53

Million € Average High Low
Sales 16,356 17,583 15,508
EBITDA before special items 1,869 2,035 1,731
EBITDA 1,833 1,965 1,731
EBIT before special items 891 1,058 792
EBIT 849 988 767
Income before income taxes 753 916 502
Net income 542 662 356
Earnings per Share (reported) (€) 0.61 0.74 0.40
Earnings per Share (adjusted) (€) 0.70 0.83 0.54

Million € Average High Low
Sales 68,301 71,195 65,841
EBITDA before special items 8,343 8,953 7,564
EBITDA 8,159 9,472 7,616
EBIT before special items 4,434 5,066 3,860
EBIT 4,173 5,066 3,686
Income before income taxes 3,636 4,406 2,959
Net income 2,676 3,703 2,033
Earnings per Share (reported) (€) 3.00 4.15 2.28
Earnings per Share (adjusted) (€) 3.50 4.15 1.73
Dividend per Share (€) 3.33 3.50 2.50
Free cashflow 702 2,443 168

Million € Average High Low
Sales 71,236 73,924 68,418
EBITDA before special items 9,451 10,485 8,307
EBITDA 9,340 11,479 8,526
EBIT before special items 5,466 6,357 4,697
EBIT 5,245 6,357 4,447
Income before income taxes 4,540 5,820 3,192
Net income 3,352 4,398 2,352
Earnings per Share (reported) (€) 3.76 4.93 2.64
Earnings per Share (adjusted) (€) 4.34 5.44 3.03
Dividend per Share (€) 3.35 3.60 2.60
Free cashflow 1,793 4,559 228

Million € Average High Low
Sales 73,990 78,150 70,701
EBITDA before special items 10,219 11,866 9,275
EBITDA 10,074 12,641 9,175
EBIT before special items 6,029 7,674 5,168
EBIT 5,853 7,674 5,030
Income before income taxes 5,188 6,872 3,716
Net income 3,748 5,177 2,758
Earnings per Share (reported) (€) 4.20 5.80 3.09
Earnings per Share (adjusted) (€) 4.75 6.22 3.49
Dividend per Share (€) 3.39 3.70 2.60
Free cashflow 3,486 5,021 726

Segment Estimates

Million €

Average High Low
Chemicals      

Sales

2,798 3,030 2,618

EBITDA before special items

433 478 387
Materials      

Sales

3,582 3,872 3,379

EBITDA before special items

493 519 455
Industrial Solutions      

Sales

2,080 2,131 2,005

EBITDA before special items

307 347 191
Surface Technologies      

Sales

3,582 3,833 3,241

EBITDA before special items

349 383 324
Nutrition & Care      

Sales

1,728 1,784 1,637

EBITDA before special items

235 272 177
Agricultural Solutions      

Sales

2,201 2,409 1,963

EBITDA before special items

382 513 293
Other      

Sales

830 1,278 630

EBITDA before special items

-112 -50 -200

Million €

Average High Low
Chemicals      

Sales

2,624 2,872 2,407

EBITDA before special items

402 459 337
Materials      

Sales

3,533 3,885 3,221

EBITDA before special items

490 558 416
Industrial Solutions      

Sales

2,046 2,162 1,955

EBITDA before special items

281 340 211
Surface Technologies      

Sales

3,799 4,172 3,362

EBITDA before special items

362 407 334
Nutrition & Care      

Sales

1,773 1,893 1,689

EBITDA before special items

225 287 188
Agricultural Solutions      

Sales

1,809 2,054 1,708

EBITDA before special items

205 272 123
Other      

Sales

772 1,102 620

EBITDA before special items

-97 -29 -200

Million €

Average High Low
Chemicals      

Sales

10,783 11,408 10,050

EBITDA before special items

1,600 1,872 1,382
Materials      

Sales

14,198 15,132 13,731

EBITDA before special items

1,888 2,111 1,740
Industrial Solutions      

Sales

8,171 8,388 7,923

EBITDA before special items

1,115 1,338 556
Surface Technologies      

Sales

14,725 15,776 13,368

EBITDA before special items

1,447 1,574 1,310
Nutrition & Care      

Sales

6,992 7,220 6,770

EBITDA before special items

870 1,106 605
Agricultural Solutions      

Sales

9,787 10,272 8,860

EBITDA before special items

2,130 2,264 1,990
Other      

Sales

3,250 5,152 2,598

EBITDA before special items

-702 22 -1,274

Million €

Average High Low
Chemicals      

Sales

11,474 12,658 10,826

EBITDA before special items

1,895 2,408 1,666
Materials      

Sales

15,089 16,000 14,126

EBITDA before special items

2,205 2,499 1,955
Industrial Solutions      

Sales

8,578 9,000 8,240

EBITDA before special items

1,174 1,341 556
Surface Technologies      

Sales

15,372 16,567 13,769

EBITDA before special items

1,558 1,771 1,349
Nutrition & Care      

Sales

7,353 7,750 7,100

EBITDA before special items

953 1,183 670
Agricultural Solutions      

Sales

10,236 10,787 9,909

EBITDA before special items

2,222 2,380 2,039
Other      

Sales

3,089 3,519 2,061

EBITDA before special items

-537 197 -905

Million €

Average High Low
Chemicals      

Sales

12,094 14,145 11,159

EBITDA before special items

2,131 2,570 1,560
Materials      

Sales

15,761 17,200 14,340

EBITDA before special items

2,440 2,834 1,986
Industrial Solutions      

Sales

8,913 9,500 8,569

EBITDA before special items

1,252 1,440 556
Surface Technologies      

Sales

15,925 17,396 14,182

EBITDA before special items

1,645 2,029 1,390
Nutrition & Care      

Sales

7,668 8,200 7,313

EBITDA before special items

1,049 1,419 725
Agricultural Solutions      

Sales

10,640 11,110 10,208

EBITDA before special items

2,328 2,481 2,143
Other      

Sales

2,793 3,550 -34

EBITDA before special items

-626 -400 -1,010

Disclaimer: This document has been issued by Vara Research GmbH for information purposes only and is not intended to constitute investment advice. It is based on estimates and forecasts of various analysts regarding revenues, earnings and business developments of the relevant company. Such estimates and forecasts cannot be independently verified by reason of the subjective character. Vara Research GmbH gives no guarantee, representation or warranty and is not responsible or liable as to its accuracy and completeness.

Last Update May 8, 2024